
Crypto Risk Monitor — September 25, 2026
• 7 min read • by Kelvin Jones
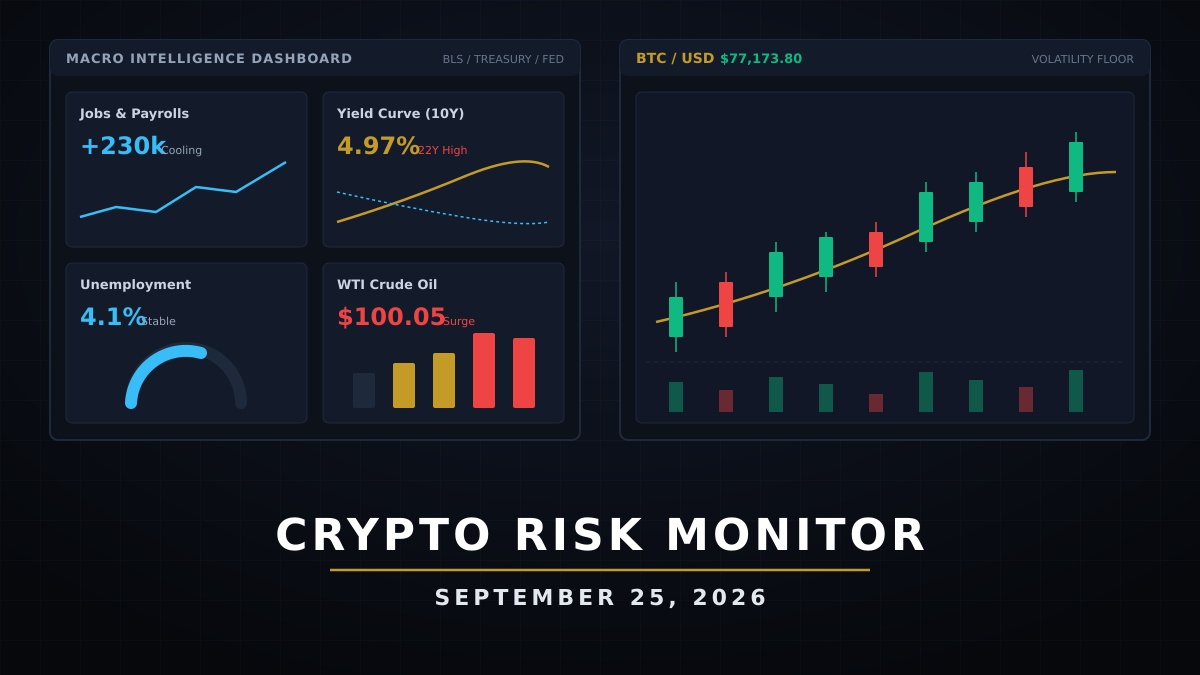
Crypto Risk Monitor — September 25, 2026
Digital Risk Report — Crypto & Macro Briefing for Smart Money
From Friday, September 18 at 9:00 a.m. EDT through Friday, September 25 at 9:00 a.m. EDT, the risk complex moved from an orderly rates repricing into a more defensive digital-asset tape. Treasury yields rose sharply into the latest available observation, while Binance hourly candles recorded a wide Bitcoin and Ethereum range before the Friday morning anchor. The evidence points to higher collateral sensitivity, not a basis for a directional forecast.
🏦 Macro Pulse — Real Yields and Energy Pressure Reasserted Themselves
The macro signal this week came primarily through rates, real yields, energy, and labor rather than a new inflation or payroll release.
- Treasury curve: U.S. Treasury daily observations reported through September 23 show the 2-year yield rising from 4.76% on September 18 to 4.85% on September 23. The 10-year moved from 5.01% to 5.11% over the same observations. Those are Treasury market data points, not an inferred estimate, and they describe a material increase in sovereign-rate pressure inside the analysis window.
- Real-rate transmission: The Federal Reserve Bank of St. Louis FRED series for the 10-year Treasury inflation-indexed security shows the 10-year real yield moving from 2.68% on September 18 to 2.76% on September 23. Higher real yields raise the opportunity cost of non-yielding collateral and tighten the liquidity transmission into long-duration risk assets.
- Labor: FRED's initial claims series, sourced from the U.S. Department of Labor, recorded 197,000 claims for the week ending September 19. This is a single weekly observation, so it is evidence of near-term labor-market conditions rather than a complete trend diagnosis.
- Energy: The FRED WTI spot series, which tracks the U.S. benchmark, printed $101.44 on September 18, $96.97 on September 21, and $96.41 on September 22. The move lowered the spot price after the Friday print, but oil remained an important inflation and margin input for the rates complex.
- Inflation and payroll releases: No CPI, PPI, or nonfarm-payroll number is used in this issue. A current-window figure could not be confirmed from an authoritative release, so prior releases are excluded rather than recycled. The same discipline applies to the dollar: no exact DXY value is stated without a current-window public observation.
Macro takeaway: The most defensible current-week signal is a rise in nominal and real Treasury yields alongside a still-material oil price. That combination increases the discount-rate burden on crypto collateral even without a new CPI or NFP shock.
💧 Crypto Liquidity Map — A Wide Range With Friday-Morning Damage
Bitcoin (BTC)
Binance BTCUSDT hourly candles covering the exact ET window recorded a high of $87,395.67 and a low of $77,972.30. The first candle opened at $78,043.12, while the candle ending at the Friday 9:00 a.m. EDT anchor closed at $83,923.71. The large intraperiod range matters more than any single close: it signals that collateral value was being repriced across sessions rather than carried through a quiet, one-directional trend.
Ethereum (ETH)
Binance ETHUSDT hourly candles recorded a high of $2,807.34 and a low of $2,494.37 in the same window. The first candle opened at $2,502.23 and the anchor candle closed at $2,695.30. ETH therefore retained a meaningful recovery from its window low, but its wider sensitivity to liquidity and risk appetite remained visible in the path between those levels.
Stablecoins and on-chain liquidity
No current-window stablecoin supply, peg-deviation, or on-chain velocity figure is included because a single authoritative public series was not verified for the full ET interval. The appropriate desk conclusion is therefore limited: spot crypto remained tradable on a major exchange, but the wide BTC and ETH ranges show that available liquidity did not prevent substantial collateral repricing.
Crypto takeaway: Digital assets absorbed a higher-real-yield shock through range expansion and lower Friday-morning structure. That is a liquidity observation, not a price prediction.
📈 Market Structure — Price Discovery Took Priority Over Flow Certainty
- The Binance hourly record provides a verified spot-market anchor for volatility, but it does not establish aggregate global volume, ETF subscriptions, or cross-venue order-book depth.
- No exact ETF net-flow, perpetual-futures open-interest, liquidation, funding-rate, options-skew, or 2% order-book-depth figure is stated. Those measures require a clearly identified public series and date alignment; unverified microstructure numbers would create false precision.
- The broad range in both assets is consistent with a market in which rates and collateral are being repriced across venues. It does not, on its own, distinguish between institutional de-risking, derivatives hedging, or spot accumulation.
- The absence of a verified flow number makes the cross-asset signal more important: the Treasury and real-yield move was observable, while claims about ETF or leverage positioning would be inferential.
Structure takeaway: This was a price-discovery week, not a week in which public evidence supports a confident claim about smart-money flow direction. The disciplined read is that macro discount rates moved first and crypto liquidity absorbed the adjustment through a wide range.
🔮 Forward Risk Outlook — Rates Data and Policy Communication Lead the Next Read
- Watch the next available U.S. Treasury observations for confirmation or reversal of the September 18-to-23 rise in 2-year, 10-year, and 10-year real yields.
- Track Federal Reserve communication for any change in the balance between inflation persistence, labor-market cooling, and the policy-rate path. No new current-window FOMC decision is used here.
- Treat the next verified CPI, PPI, labor, or PCE release as a new information event rather than importing a prior-week number into this briefing.
- Monitor whether BTC and ETH can trade with narrower ranges as rates stabilize, or whether another move in real yields again transmits into collateral volatility.
- Recheck stablecoin supply, exchange funding, options skew, and ETF flow data only when each series is available with a public source and matching observation date.
Forward-looking frame: The near-term setup is conditional on the rates curve. A sustained real-yield rise would keep pressure on liquidity-sensitive collateral; a stabilization would allow market structure to be assessed without conflating a rates shock with a crypto-specific failure.
🧭 Bottom Line
The September 18-to-25 window produced a clear macro-to-crypto transmission: Treasury's 2-year and 10-year yields rose between September 18 and September 23, FRED's 10-year real-yield measure also rose, and Binance hourly data showed broad BTC and ETH ranges into the Friday morning anchor. WTI declined from the September 18 observation but remained elevated enough to matter for the inflation and rates conversation. The labor signal was limited to one DOL-sourced weekly claims observation.
Smart money is watching:
- Whether 10-year real yields hold above the September 18 observation
- The next verified Treasury curve readings
- The interaction between WTI and inflation expectations
- BTC range stability after the Friday morning $83,923.71 anchor close
- Whether public ETF, derivatives, and stablecoin data confirm or contradict the macro signal
The institutional conclusion is narrow but actionable for risk measurement: crypto behaved as collateral exposed to sovereign-rate repricing, and the available public evidence does not justify a stronger directional claim.
Published September 25, 2026. Last updated September 25, 2026.
Frequently asked questions
What is the Crypto Risk Monitor?
A weekly institutional-grade briefing covering crypto liquidity, macro data, volatility, and digital asset flows.
Why does this week matter?
A sharp repricing in Treasury yields and energy prices coincided with weaker digital-asset price structure and a fresh weekly claims reading.
How does this help traders and analysts?
It frames how macroeconomic conditions and liquidity feed directly into digital asset collateral dynamics and market structure.