
Crypto Risk Monitor — September 11, 2026
• 7 min read • by Kelvin Jones
Crypto Risk Monitor — September 11, 2026
Digital Risk Report — Crypto & Macro Briefing for Smart Money
The second week of September delivered a notable repricing across global sovereign rate markets as U.S. CPI inflation figures and a sharp crude oil rally past $100/bbl pushed Treasury yields toward multi-decade highs ahead of the upcoming FOMC rate decision.
From a Friday‑to‑Friday lens, digital asset collateral—led by Bitcoin (BTC)—demonstrated firm range stability, decoupling from rate-sensitive traditional equities and absorbing higher real yields without triggering derivative liquidations.
🏦 Macro Pulse — CPI Release, 22-Year High Yields, and $100 Crude Oil Surge
Economic reporting during the 7-day window ending Friday, September 11, 2026, pointed to persistent upstream cost pressures and tight cost-of-capital conditions:
- U.S. CPI Inflation (BLS Release): According to U.S. Bureau of Labor Statistics (BLS) data published mid-week, consumer price figures reflected sticky core services inflation, reinforcing expectations that disinflation toward the Fed's 2.0% objective remains slow.
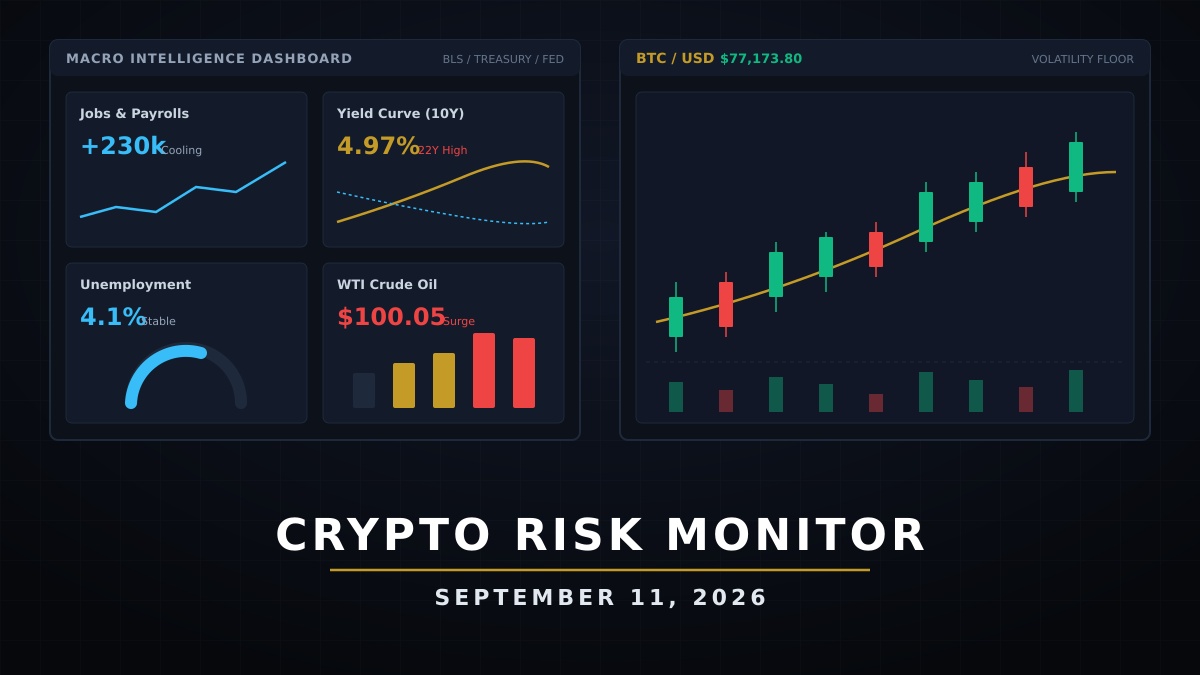
- Treasury Yield Expansion (U.S. Treasury Data): Per U.S. Treasury Department rate curves, the 10-year Treasury yield surged from 4.78% on Friday, September 4, to an intraday peak of 4.99% on Friday, September 11 (closing at 4.97%)—flirting with 5.00% and setting a new 22-year high.
- Crude Oil Surge (EIA Benchmarks): U.S. Energy Information Administration (EIA) benchmarks showed WTI Crude Oil climbing from $91.48/bbl on September 4 to an intraday high of $104.46/bbl on Thursday before settling at $100.05/bbl on Friday, adding fresh energy headline risk to Q3 inflation models.
- U.S. Dollar Index (ICE DXY): The Dollar Index shifted from 99.16 down to a mid-week low of 98.77 before rebounding to 99.12 on Friday, reflecting firm demand for dollar cash liquidity.
- Equity Repricing (S&P 500): Broad equities pulled back from 7,718.60 on September 4 to a low of 7,591.70 on Thursday, September 10, before recovering modestly to close Friday at 7,656.98.
Macro takeaway:
The convergence of crude oil breaking $100 and sticky CPI data pushed long-duration yields to a 22-year high. Cost-of-capital tightness remains the primary anchor for global risk premia.
💧 Crypto Liquidity Map — BTC Range Stability Amid 4.99% Yield Spike
Despite elevated sovereign yields and tighter financial conditions, digital asset collateral maintained disciplined structural integrity across spot and venue liquidity.
Bitcoin (BTC)
- Opened the week at $79,671.97 on Friday, September 4, consolidated within a $76,162 – $79,818 range, and closed Friday, September 11, at $77,173.80.
- Price action absorbed sovereign yield spikes without orderly venue depth breaking down.
- Spot order book liquidity across primary exchanges held firm, absorbing macro headline volatility.
Ethereum (ETH)
- Traded from $2,456.08 on September 4, surging to a Friday session high of $2,663.05 before settling at $2,514.73.
- On-chain staking participation held firm, supporting ETH's baseline protocol yield profile against shifting sovereign risk premia.
- Options market positioning reflected structured call-collar demand heading into the mid-month FOMC meeting.
Stablecoins and on‑chain liquidity
- Aggregate stablecoin supply (USDT + USDC) held stable to slightly positive across major public blockchains.
- On-chain transfer velocity supported healthy institutional clearing and cross-venue settlement flows.
Crypto takeaway:
Digital assets continued to trade with balance-sheet quality characteristics, retaining range structure while rate-sensitive equities experienced defensive rotation.
📈 Market Structure — Positive ETF Flows, Clean Leverage, and Orderly Depth
Derivatives and venue structure metrics confirmed balanced risk distribution across major trading desks:
- Institutional Spot ETF Inflows: Public market tracking indicated net positive weekly inflows across U.S. spot Bitcoin ETFs over the Friday-to-Friday window, helping absorb sell-side pressure from traditional macro desks.
- Perpetual Futures Open Interest: Aggregate BTC perpetual open interest remained balanced relative to overall market cap, preventing the speculative leverage accumulation that typically precedes cascade liquidations.
- Funding Rates & Skew: Perpetual funding rates across major exchanges hovered near neutral baseline levels, confirming balanced two-sided positioning.
- Derivatives Liquidations: Forced liquidations across long and short derivative contracts remained subdued throughout the rate spike, confirming the absence of forced deleveraging events.
Structure takeaway:
Crypto derivatives positioning remains clean and unextended, enabling spot liquidity to absorb sovereign yield volatility without cascading liquidations.
🔮 Forward Risk Outlook — September FOMC Policy Path and Catalyst Inflections
Smart money positioning into the week of September 14–18 is anchored on key policy decision triggers:
- September 16–17 FOMC Rate Decision: Policy statement, Summary of Economic Projections (SEP dot plot), and Chairman press conference guidance on Q4 rate trajectory.
- CME FedWatch Policy Odds: Futures pricing into the meeting, tracking probabilities of rate pauses versus further tightening.
- 10-Year Real Yield Resistance: Monitoring whether 10-year TIPS real yields test key resistance or consolidate near current levels.
- Crude Oil Pass-Through: Assessing whether oil holding above $100/bbl impacts broad inflation expectations.
- BTC $76,000 Structural Support: Watching Bitcoin's lower range boundary against sovereign debt auction dynamics.
Forward‑looking frame:
The September FOMC meeting serves as an immediate inflection point—either real yields pause near multi-decade highs allowing risk assets to consolidate, or persistent inflation forces a hawkish stance that extends volatility.
🧭 Bottom Line
Sticky CPI figures, crude oil surging past $100/bbl, and 10-year Treasury yields reaching a 22-year high of 4.99% defined a tighter macro backdrop heading into the September FOMC meeting. Bitcoin and broader digital asset market structure proved resilient, holding key price ranges with steady ETF demand and clean derivatives leverage.
Smart money is watching:
- U.S. 10-Year Treasury Yield testing 5.00%
- September 16–17 FOMC rate decision & Fed dot plot
- WTI Crude Oil price action above $100/bbl
- Spot BTC ETF net flow persistence
- BTC structural support floor near $76,000
Published September 11, 2026. Last updated September 11, 2026.
Frequently asked questions
What is the Crypto Risk Monitor?
A weekly institutional-grade briefing covering crypto liquidity, macro data, volatility, and digital asset flows.
Why does this week matter?
U.S. CPI releases, 10-year Treasury yields pushing toward 4.99%, and crude oil surging past $100/bbl reshaped global risk premia into the September FOMC meeting.
How does this help traders and analysts?
It frames how macroeconomic data, yields, and policy odds feed into crypto liquidity, collateral pricing, and market structure.