
Crypto Risk Monitor — October 9, 2026
• 8 min read • by Kelvin Jones
Crypto Risk Monitor — October 9, 2026
Digital Risk Report — Crypto & Macro Briefing for Smart Money
From Friday, October 2 at 9:00 a.m. EDT through Friday, October 9 at 9:00 a.m. EDT, Treasury yields eased modestly from the window's opening observations while Bitcoin and Ether ended lower on Binance's hourly spot record. The latest in-window labor signal was steady weekly claims, and the newest available oil and real-yield observations were published before the Friday cutoff. Those data point to some relief in nominal rates, but do not establish a broad improvement in liquidity or a change in the inflation outlook.
🏦 Macro Pulse — Slightly Lower Yields, With Inflation Risk Still in View
- Labor: The U.S. Department of Labor's October 8 weekly claims release reported 197,000 initial claims for the week ending October 3, down 2,000 from the prior week's revised 199,000. The four-week average was 198,000, down 2,500. This is a timely, narrow labor-market indicator, not evidence by itself of a broad acceleration or deterioration in employment. The September employment report was released at 8:30 a.m. on October 2, thirty minutes before this issue's analysis window began, so its payroll and unemployment figures are not treated as current-window events.
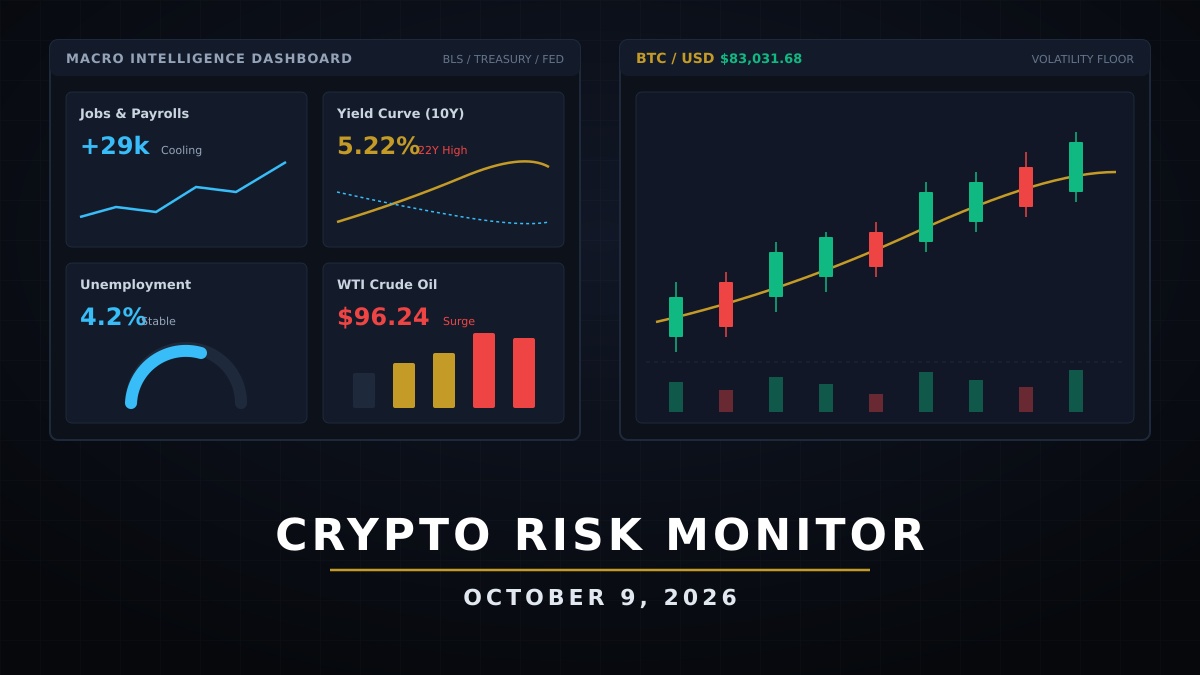
- Treasury curve: The U.S. Treasury's daily par curve put the 10-year yield at 5.28% on October 2 and 5.22% on October 8, the latest observation available before the anchor. The 2-year stood at 4.83% and 4.75% on those dates, respectively. The 2s/10s spread moved from 45 to 47 basis points: both maturities declined, with a small additional steepening rather than a sharp change in curve shape.
- Real rates: The Federal Reserve Bank of St. Louis FRED 10-year TIPS series (DFII10) was 2.92% on October 2 and 2.92% on October 7, its latest published observation available at the cutoff. It ranged from 2.91% to 2.95% across the reported October 2–7 observations. The real-yield record therefore showed little net change through October 7, but cannot establish the October 8–9 move.
- Energy: EIA's WTI spot-price series, distributed through FRED as DCOILWTICO, recorded $97.89 per barrel on October 2 and $96.24 on October 6, the latest observation available in the series before the October 9 anchor. That is a 1.7% decline between the two published observations, not a complete Friday-to-Friday oil return. EIA marked its table updated October 7 and listed October 15 as its next release date.
- Inflation and the dollar: No CPI or PPI release fell inside October 2–9. The BLS calendar lists September CPI for October 14 and PPI for October 15, both outside this analysis window. No current-window ICE U.S. Dollar Index (DXY) observation was verified; FRED's broad trade-weighted dollar series is not the same index and did not provide a sufficiently current observation for a weekly DXY conclusion.
- Federal Reserve: On October 7, the Federal Reserve published minutes of its September 15–16 FOMC meeting. On October 8, Governor Christopher Waller discussed the September 25-basis-point increase to a 3.75%–4.00% target range and the inflation and labor considerations behind his policy view. These were current-week releases and communication, but the September policy decision itself preceded this window. Neither item is a new October policy decision.
Macro takeaway: The Treasury curve moved slightly lower between its October 2 and October 8 observations, while the available TIPS data were nearly unchanged through October 7. Claims remained contained in the October 8 report, and the latest published WTI observation edged down. CPI, PPI, and a properly timestamped DXY series did not provide an in-window reading, so the evidence supports a measured rates-and-labor assessment rather than a comprehensive inflation or dollar signal.
💧 Crypto Liquidity Map — Wider Collateral Pressure as BTC and ETH Fell
Bitcoin (BTC)
Binance BTCUSDT hourly spot candles for the exact EDT window opened at $86,810.01 at 9:00 a.m. on October 2 and closed at $83,031.68 at the October 9, 9:00 a.m. anchor, a 4.35% decrease between those boundary observations. The window high was $87,150.00 at its opening hour; its low was $80,393.56 in the October 8, 1:00 p.m. EDT candle. The move shows a meaningful decline and intraperiod drawdown in the value of BTC collateral, without implying that all venues or holders experienced the same execution prices.
Ethereum (ETH)
The corresponding Binance ETHUSDT hourly series opened at $2,755.19 and closed at $2,498.00, down 9.33% between the two boundary observations. Its in-window high was $2,769.68 in the opening hour, and its low was $2,406.11 on October 8 at 1:00 p.m. EDT. Ether's larger decline than Bitcoin's in this single venue's spot record underscores differing collateral sensitivity during the week; it does not, by itself, identify the cause.
Stablecoins and on‑chain liquidity
No timestamp-aligned public series for stablecoin supply, peg deviations, or cross-chain settlement was verified for the exact October 2–9 interval. No claim about stablecoin depth or on-chain liquidity direction is made. The Binance spot record establishes price movement on one venue, not aggregate global order-book depth or settlement conditions.
Crypto takeaway: Both assets finished below their October 2 opening marks, and both reached their recorded weekly lows on October 8. The exact-hour boundaries make the comparison reproducible; the venue-specific sample should not be mistaken for a consolidated market index.
📈 Market Structure — Spot Turnover Is Observable, Positioning Is Not
- The 168 hourly Binance candles in the analysis window sum to approximately 8.95 billion USDT in BTCUSDT quote volume and 4.87 billion USDT in ETHUSDT quote volume. These are single-venue pair totals from Binance's public spot-kline endpoint, not consolidated dollar turnover or proof of global market share.
- The negative boundary-to-boundary returns and October 8 lows are consistent with weaker spot marks over the measured window. They do not establish whether ETF flows, leverage, or discretionary positioning caused the move.
- No reliably dated, complete ETF net-flow series for all sessions through the 9:00 a.m. October 9 cutoff was verified here. Exact ETF totals are therefore omitted rather than inferred from an incomplete session.
- Timestamp-matched perpetual-futures open interest, funding rates, options skew, liquidation totals, and order-book depth were not verified from a consistent public source for this window. No numeric claims are made about leverage or forced selling.
Structure takeaway: Public spot data confirm substantial venue activity alongside lower BTC and ETH anchor marks. Without aligned flow and derivatives observations, the responsible conclusion is that prices repriced lower, not that any single positioning mechanism has been proven.
🔮 Forward Risk Outlook — CPI and PPI Become the Next Inflation Tests
- The September CPI release is scheduled by the BLS for Wednesday, October 14; the September PPI release is scheduled for Thursday, October 15. Both are outside this issue's measurement window and should be assessed as new releases, not anticipated as facts.
- Follow the next Treasury par-curve observations for whether the October 2–8 easing in 2-year and 10-year yields persists, and compare that path with newly published 10-year real yields.
- Watch for the next DOL initial-claims release and distinguish one weekly reading from a sustained labor-market trend.
- Track EIA's next scheduled petroleum-price update on October 15. Until a current observation is published, do not extend the October 6 WTI quote into a full-week return.
- Reassess BTC and ETH against the October 8 lows using timestamped spot data. The present window shows the drawdown, not whether liquidity conditions or the price path subsequently stabilize.
Forward-looking frame: CPI and PPI will add fresh inflation evidence, while claims and the yield curve will help frame labor and discount-rate transmission. Until then, the measured conclusion is limited to the data already published through the Friday morning cutoff.
🧭 Bottom Line
Between the October 2 and October 9, 9:00 a.m. EDT anchors, Binance hourly BTCUSDT and ETHUSDT spot prices fell 4.35% and 9.33%, respectively, and both recorded their window lows on October 8. Treasury's October 8 curve was modestly lower than its October 2 curve, while the latest available real-yield and WTI observations were dated October 7 and October 6. The October 8 claims report was steady, and the Fed's minutes and a Waller speech kept inflation and policy trade-offs in view. Lagged observations and the absence of aligned flow data constrain how far the week's moves can be interpreted.
Smart money is watching:
- Whether 2-year and 10-year Treasury yields continue lower or reverse
- The next available 10-year TIPS real-yield observations
- October 14 CPI and October 15 PPI, once released
- Weekly initial claims and the difference between a single print and trend
- BTC and ETH spot ranges alongside verified ETF and derivatives data
The evidence describes a week of lower crypto marks alongside modestly easier nominal yields; it does not yet establish a durable change in macro pressure or market liquidity.
Published October 9, 2026. Last updated October 9, 2026.
Frequently asked questions
What is the Crypto Risk Monitor?
A weekly institutional-grade briefing covering crypto liquidity, macro data, volatility, and digital asset flows.
Why does this week matter?
Key macro headlines across inflation, rates, and labor reshaped risk premia and collateral pricing across crypto and global markets.
How does this help traders and analysts?
It frames how macroeconomic conditions and liquidity feed directly into digital asset collateral dynamics and market structure.