
Crypto Risk Monitor — October 16, 2026
• 9 min read • by Kelvin Jones
Crypto Risk Monitor — October 16, 2026
Digital Risk Report — Crypto & Macro Briefing for Smart Money
From Friday, October 9 at 9:00 a.m. EDT through Friday, October 16 at 9:00 a.m. EDT, Bitcoin and Ether ended modestly lower on Binance's hourly spot record, despite trading through materially wider intraperiod ranges. September CPI and PPI releases arrived during the window and showed a pronounced rise in headline prices, while the latest available Treasury and real-yield observations through October 14 eased from October 9. The mix raises the cost-of-capital and inflation questions without establishing a single cause for crypto's price path.
🏦 Macro Pulse — Higher Inflation Prints, Lower Latest Long-End Yields
- Inflation: The U.S. Bureau of Labor Statistics (BLS) released September CPI on Wednesday, October 14. The all-items index rose 0.6% month over month and 3.7% year over year; core CPI increased 0.3% month over month and 2.6% year over year. The monthly comparisons are seasonally adjusted; annual comparisons are not. The release documented a strong headline increase alongside a smaller core reading, rather than a broad claim about every price category (BLS CPI release).
- Producer prices: On Thursday, October 15, BLS reported that September final-demand PPI advanced 1.3% month over month and 6.3% year over year. The monthly figure is seasonally adjusted and the annual figure is not. The producer-price increase adds upstream inflation pressure to the CPI signal, though neither index alone specifies how quickly costs pass through to consumer prices (BLS PPI release).
- Labor: The U.S. Department of Labor's October 15 weekly claims release put initial claims for the week ending October 10 at 199,000, up from the previous week's revised 198,000. The four-week moving average was 198,500. Claims remain a timely but narrow measure of layoffs, not a substitute for the monthly employment report (Department of Labor weekly claims release).
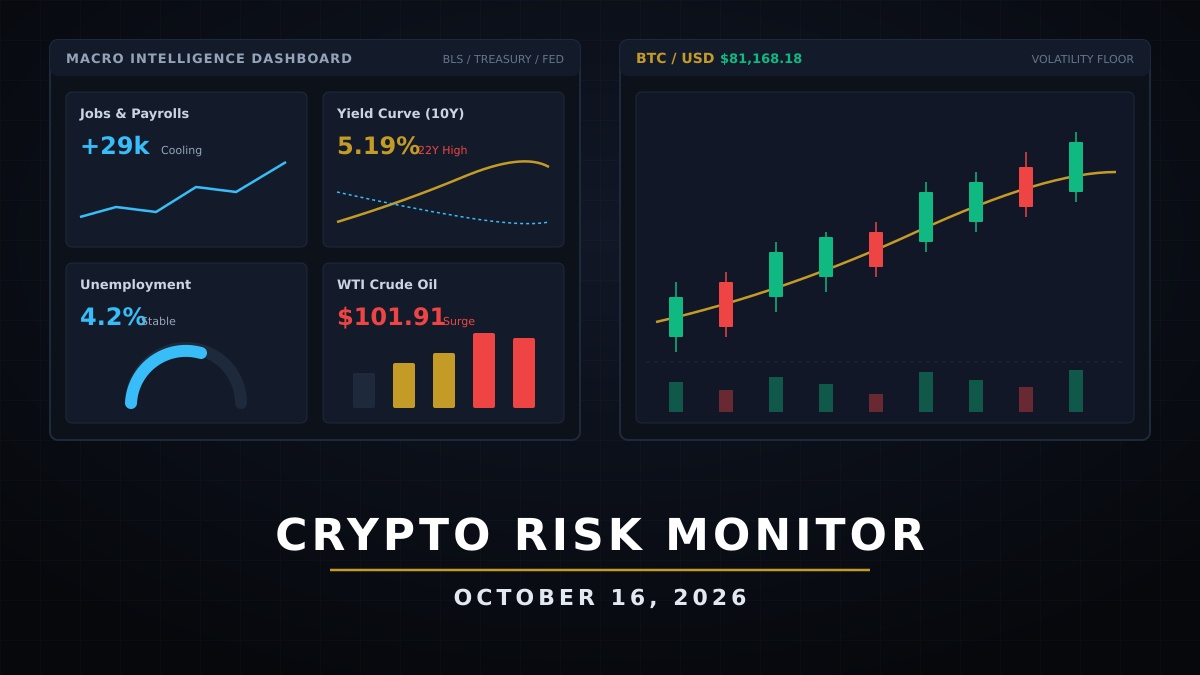
- Treasury curve and real rates: FRED's daily observations show the 10-year Treasury yield at 5.24% on October 9 and 5.19% on October 14, its latest available observation by the Friday morning cutoff. The 2-year yield moved from 4.80% to 4.82% over the same dates, leaving the 2s/10s spread narrower by seven basis points. The 10-year TIPS real yield eased from 2.91% to 2.84%. These dated observations describe a modest decline at the long end and in real yields, not a full-window October 15–16 rates move (FRED DGS10, DGS2, DFII10).
- Energy and the dollar: EIA's WTI spot series distributed through FRED rose from $98.73 per barrel on October 9 to $101.91 on October 14, the latest available observation in that series before publication. The broad trade-weighted U.S. dollar index was 121.60 on October 9, but no current-window ICE DXY observation was verified; the broad index is not interchangeable with DXY (EIA WTI series, FRED broad dollar index).
- Federal Reserve: No new FOMC decision occurred in this analysis window, and no independently verified, cutoff-timestamped CME FedWatch probability is quoted. The Federal Reserve's next scheduled meeting is October 27–28, so the new inflation data and incoming yields will inform expectations ahead of that decision (FOMC calendar).
Macro takeaway: September's CPI and PPI releases strengthened the inflation signal, while the last available Treasury observations through October 14 showed lower 10-year nominal and real yields than on October 9. WTI rose between the same dated observations, and the dollar series was too stale to support a full-week DXY conclusion. The combination argues for monitoring how inflation, energy, and discount rates interact rather than assigning crypto's movement to one macro variable.
💧 Crypto Liquidity Map — Weekly Closes Masked Wider Intraday Ranges
Bitcoin (BTC)
Binance BTCUSDT one-hour candles for the exact EDT window opened at $83,031.69 at 9:00 a.m. on October 9 and at the October 16, 9:00 a.m. endpoint marked $82,052.49, a 1.18% decline between those observations. The window high was $84,352 at 2:00 a.m. EDT on October 12; the low was $79,800 at 9:00 a.m. EDT on October 15. The close-to-close comparison is modest beside the larger intrawindow drawdown, which matters when BTC is used as collateral.
Ethereum (ETH)
The matching Binance ETHUSDT hourly series moved from $2,498.00 at the October 9 anchor to $2,463.01 at the October 16 anchor, down 1.40%. Ether's in-window high was $2,579.88 at 3:00 a.m. EDT on October 12; its low was $2,318.00 at 10:00 p.m. EDT on October 14. The wider low-to-high path shows why a weekly endpoint alone does not describe collateral variability.
Stablecoins and on-chain liquidity
No historical, timestamp-aligned public series for stablecoin supply, peg deviations, or cross-chain settlement was verified for the complete October 9–16 interval. No numeric claim about stablecoin depth or on-chain liquidity is made. Binance spot candles measure one venue and do not establish conditions across exchanges, chains, or lending markets (Binance public spot-kline API).
Crypto takeaway: BTC and ETH both finished below their October 9 anchor prices, with losses of about 1%–1.5%, but each traded substantially below its weekly high before the endpoint. The hourly Binance record makes that range measurable; it cannot establish aggregate market depth or explain the underlying drivers.
📈 Market Structure — Mixed ETF Sessions and Venue-Specific Turnover
- ETF participation: Farside Investors' daily U.S. spot Bitcoin ETF table showed both inflow and outflow sessions from October 9 through October 15, rather than a consistent one-way flow. October 16 is excluded because its session was incomplete at the 9:00 a.m. EDT cutoff. Daily flow reporting is useful context, but does not identify the marginal buyer or explain spot returns (Farside Bitcoin ETF flows).
- Spot activity: The 168 hourly Binance observations sum to approximately $7.93 billion in BTCUSDT and $4.60 billion in ETHUSDT quote volume. These are single-venue pair totals, not consolidated exchange turnover or a measure of executable depth.
- Positioning and liquidity: No complete, cutoff-aligned public series for perpetual-futures open interest, funding rates, options skew, or order-book depth was verified for this window. Those measures are therefore not assigned numeric values or causal weight. Price ranges and Binance spot turnover alone cannot distinguish hedging, leverage changes, or directional demand.
Structure takeaway: ETF flows were mixed across completed sessions, and Binance recorded material spot turnover while both assets ended lower. Without aligned derivatives and depth observations, the data support a venue-specific description of trading, not a claim that leverage or institutional flows drove the week's move.
🔮 Forward Risk Outlook — Inflation Pass-Through and the Next Fed Decision
- Follow new 2-year, 10-year, and TIPS observations to see whether the October 14 easing in longer-term nominal and real yields persists after the CPI and PPI releases.
- Compare the next published WTI observations with the October 9–14 rise; energy remains a relevant input to both headline inflation and broader cost expectations.
- Use subsequent weekly initial-claims readings to test whether the October 15 release is part of a trend or a one-week fluctuation.
- Ahead of the October 27–28 FOMC meeting, watch how market pricing responds to inflation and rates data. No precise FedWatch probability is stated here because a cutoff-aligned observation was not independently verified.
- Reassess BTC and ETH collateral ranges alongside complete ETF and derivatives data; this week's spot range does not establish the next week's direction.
Forward-looking frame: The immediate question is whether firm September inflation and rising WTI are reflected in subsequent yields, while the October FOMC meeting remains the next major policy catalyst. Until those observations arrive, the current evidence supports scenario monitoring rather than a directional forecast.
🧭 Bottom Line
Between the October 9 and October 16, 9:00 a.m. EDT anchors, Binance spot prices declined 1.18% for BTC and 1.40% for ETH, with lows materially below the weekly highs. September CPI and PPI both rose sharply in their monthly releases, claims remained near 200,000, and the latest available October 14 Treasury observations showed the 10-year and real yields lower than on October 9. WTI rose over those same dated observations, while the dollar and market-structure records were incomplete for a full-window conclusion.
Smart money is watching:
- Whether the 10-year and TIPS yields stabilize or reverse after the inflation releases
- The next WTI observation and its relationship to headline inflation
- Weekly claims beyond the October 15 reading
- Completed Bitcoin ETF flows and verified futures positioning
- BTC and ETH collateral ranges across more than one venue
The record is consistent with unsettled inflation and cross-asset pricing, but it does not identify a single cause for crypto's intraperiod drawdowns or establish a durable change in liquidity.
Published October 16, 2026. Last updated October 16, 2026.
Frequently asked questions
What is the Crypto Risk Monitor?
A weekly institutional-grade briefing covering crypto liquidity, macro data, volatility, and digital asset flows.
Why does this week matter?
September inflation releases, firmer producer prices, and mixed rates and energy observations shaped the week's collateral and liquidity backdrop.
How does this help traders and analysts?
It frames how macroeconomic conditions and liquidity feed into digital asset collateral dynamics and market structure.